Awesome Sustainability Data
What is Awesome Sustainability Data?
Gathering up sustainability data – including water, waste energy and emissions – is the first step in preparing disclosures to investors, regulators and customers. With harmonization of regulatory and financial reporting standards around the globe, attention is turning to data quality.
Use this GLYNT.AI Guide to learn what is required, the common pitfalls and the specific dimensions of sustainability data that meets the needs of investors, regulators and customers.
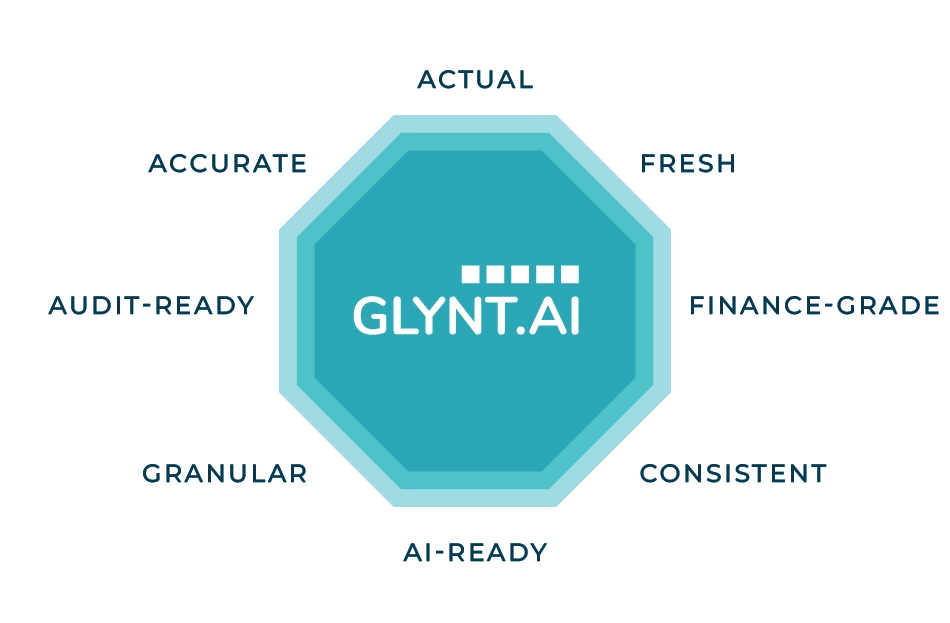
GLYNT.AI defines Awesome Sustainability Data by the eight attributes in the image on the right.
Each attribute has a story to tell. While other GLYNT.AI Guides cover how to prepare sustainability data with automation and AI, here we focus on the qualities of the data itself.
The bottom line? Awesome sustainability data is data your CFO will love. It is as rigorously prepared as financial data, and it reveals savings opportunities and key risks.
Awesome sustainability data has the CFO’s confidence that it is ready to use in business decisions and ready to disclose to investors.
THE EIGHT ATTRIBUTES OF AWESOME SUSTAINABILITY DATA
1 Actual Data
What is It?
Actual sustainability data can be tracked back to the Source File, which is typically a business invoice or data output from IoT sensor. ERP and AP systems typically don’t process the data items needed, so reprocessing Source File is required.
What’s the Challenge?
Two common problems lead to the use of estimates (e.g. non-actual data):
1) The data is not in the business system, so estimates are used. See the example on the right.
2) There are too many Source Files for sustainability teams to handle, so estimates are used instead.
What’s the Consequence?
Investors, customers and regulators have gone beyond “Show me your numbers” and now ask “Show me your progress.” Only actual data can demonstrate year over year reductions.
How to Get It
There’s really no short cut: Find the Source Files and the outputs of IoT sensors. Extract the data, aggregate and harmonize. Great reporting starts with great data, which starts with Source Files.
EXAMPLE
SCOPE 2 DATA: ESTIMATES VS ACTUAL
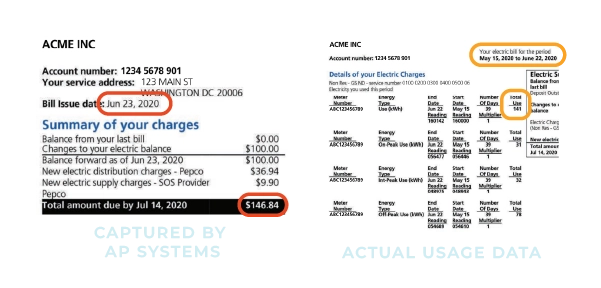
Accounts payable (AP) systems typically capture just the data needed to pay the bill, such as the statement date, the current charges and the total amount due. AP system miss the usage data – such as kWh used – and the details of when and where the usage occurred.
As the second page of the bill shows, finding these data elements in a sea of numbers requires expertise. Which usage figure should be used and why?
To avoid these challenges and to save time, some teams estimate usage by dividing Total Amount by average price (from an external source). But estimated data can’t be used to build the business case for change, or for key decisions. It quickly traps the sustainability team into a reporting-only function, while actual data enables identification and budgeting for savings, profits and revenue growth.
2 Accurate Data
What is It?
Data accuracy is the degree to which data correctly represents the real-world event it is intended to describe. For sustainability this includes activities, such as water or energy usage, and emissions from that activity.
What’s the Challenge?
When sustainability data is prepared from Source Files there are many steps from the original data to the finished data product: cleaning, normalization, harmonization, enrichment, customization and so on. With so many steps, it is easy to make an error.
What’s the Consequence?
Inaccurate data can be embarrassing. Imagine every month you report the correct amount for a data category, $4, and one month you make an error and report $5. When everyone digs into the “problem”, they track back through the calculations to find the error. Suddenly all the trackbacks are questioned – where are the other hidden errors?
How to Get It
Accurate data comes from a system of data preparation that is tested and validated, and constantly monitored for data health. Within the system, there should be a sequence of tests, so that accuracy is maintained from start to finish.
EXAMPLE
A COMMON DATA ERROR IN AGGREGATION
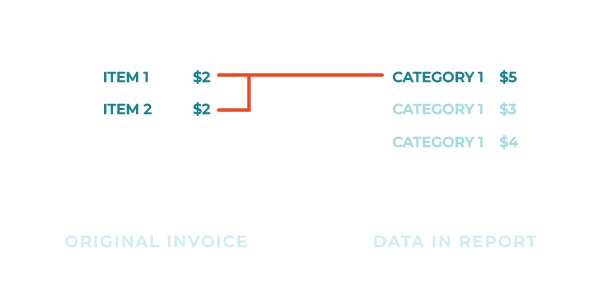
Accurate data is not only capturing the characters from the invoice correctly, such as ’803’ not ‘808’, but assigning data to reporting categories. In fact, it is the latter case – poor assignment logic – that leads to many data errors.
Get ready for audits with reports on chain of custody and data lineage and recognize that it takes a system to produce accurate data.
3 Fresh Data
What is It?
Fresh data is delivered to sustainability systems on a daily, weekly or monthly basis. It allows sustainability teams to know that their analytics are always up-to-date.
What’s the Challenge?
Automated systems are a must-have for monthly updates. Ad hoc systems just crumple under the brisk pace. A business that plans to provide frequent updates should plan on investing in their sustainability systems or to use an automated provider.
What’s the Consequence?
There’s an embarrassing moment every sustainability team has faced: Delivering last year’s results in July. This happens with ad hoc systems that take months to compile annual reports.
With a few years of reporting under their belt, most companies move on to automated services. There’s nothing like closing the sustainability report within days of the financial reports. It’s a moment of pride!
How to Get It
Fresh, updated data requires automation. Build it in-house or use an automated provider like GLYNT.AI. There is just no shortcut.
EXAMPLE
THE MANY REPORTING DATES OF 2025
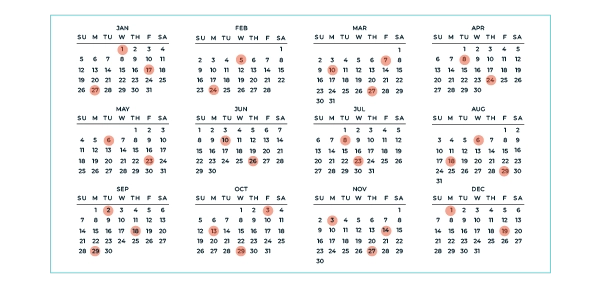
Fast forward to our new era, with harmonized reporting standards, assurance reviews, and keen interest by investors, customers and employees on sustainability progress updates. In our new era, expect customer requests for your latest data and reports several times a month.
No one wants to be told in May that the calculations for the prior year are still underway. No one wants to be told in November the latest data is from the previous year.
Fresh data throughout the year builds confidence in your sustainability narrative and demonstrates your sustainability data management skills.
4 Audit-Ready Data
What is It?
Internal and external audits focus on the method of data preparation: Is it unbiased? Is it accurate? Can decisions be reliably made from the data? Audit-ready data comes from a system that passes these tests.
What’s the Challenge?
Current data preparation methods often rely on spreadsheets and ad hoc data transfers. These are difficult to audit as they lack monitoring, and validation of chain of custody and data lineage. Building in tests for data quality is expensive, so a best-efforts level of error resolution is used.
What’s the Consequence?
Everyone wants a “clean” (no qualifications) audit report. But without a well-developed method of data preparation, auditors may flag key risks for data users.
Investors are demanding Integrated Reporting (e.g. sustainability data tied to financial records) and audits. Financial reporting standards such as IFRS, are on this pathway too. Data users have rising expectations for data quality; Don’t get left behind!
How to Get It
The only way to get audit-ready data is to use an audit-ready data preparation system. You can build one yourself or use a certified data preparation service.
EXAMPLE
THE AUDIT-READY SYSTEM
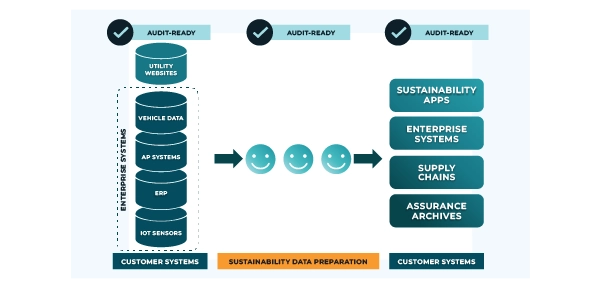
There is a standard flow to sustainability data preparation: Pull Source Files from business systems (shown on the left), prepare the data, send prepared data to the next set of business systems (shown on the right). The question is: What happens in the middle?
Ad hoc, spreadsheet-based systems can fail an audit, and break the end-to-end compliance. An in-house system must build in all the tests and controls to pass the audit, an expensive process.
The third option is to use a certified third-party service such as GLYNT.AI. Our system already passed the audit. We’ll provide documentation and reporting with our data service. You get audit-ready data from an audited system.
5 Finance-Grade Data
What is It?
Finance-grade sustainability data is prepared as rigorously as sustainability data and can be used with confidence in capital budgeting and external financing.
What’s the Challenge?
As anyone who has built or maintains a financial data system can tell you: “It’s hard work!” The same is true for sustainability data. Public companies who report financial data must be Sarbanes-Oxley (SOX) compliant. This an expensive and time-consuming build out of infrastructure. But without it, sustainability data lacks the verification and reliability CFOs require. So the challenge is “It’s hard work!” And expensive.
What’s the Consequence?
With global reporting standards harmonized, and regulatory requirements clear, we’re in a new era for sustainability data. The politics of 2025 are not key. Investor demands for rigorous and audited finance-grade sustainability data is. As sustainability moves to becoming part of financial disclosures, the consequence of bad data become larger, harming the brand, the company reputation and possibly leading to lawsuits and fines.
How to Get It
The only way to get finance-grade data is to use a SOC 1 certified data preparation system. You can build one yourself or use a data service. Think of it this way: The persistent investor demand for sustainability data reflects their persistent concerns about the cost of climate change. Build a system or use an automated data service. See those costs for yourself.
EXAMPLE
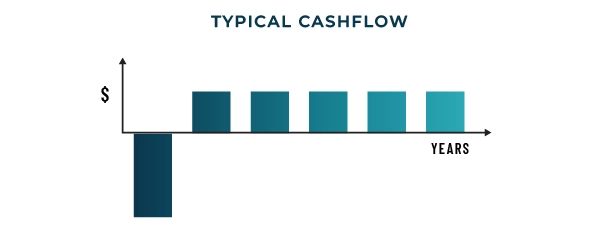
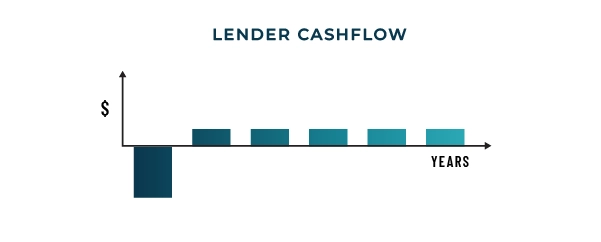
FINANCE-GRADE DATA IS KEY TO THE BUSINESS
OF SUSTAINABILITY
1 THE BUSINESS CASE MAKES SENSE TO INTERNAL FINANCE TEAMS
2 PROJECT MAKES SENSE TO LENDERS AND INVESTORS
6 Granular Data
What is It?
Granular data is the fine-grained, detailed data on energy, water and waste usage that drives reduction plans. This data is found on energy invoices, utility bills, business invoices and from IoT sensor platforms.
What’s the Challenge?
In the rush to get the first round of reporting done, many new sustainability efforts focus on historical baselines, forgetting that regulators, investors and customers are also looking for a credible reduction plan. The challenge is to meet the reporting deadlines, with a baseline AND a reduction plan. The latter requires granular data.
What’s the Consequence?
Typical sustainability systems capture one data point on usage per month per site at best. But without matching usage data to equipment, machinery and places, it is impossible to identify and evaluate the costs of reductions. Granular data is needed to build the business case.
How to Get It
The easiest and cheapest granular data is on energy, business and utility invoices. Use a system that reads all the data details. IoT sensors are a second way to capture and track granular data. Invoice and IoT data can be integrated and mapped at each site to the floor and equipment layout, providing a complete picture of usage and costs.
EXAMPLE
HOW GRANULAR DATA BUILDS THE BUSINESS CASE
FOR REDUCTIONS

When this granular usage data is matched to machinery in plant, or HVAC systems in a building, it creates the opportunity to examine energy reduction options by asset.
What is the cost of a change? How much energy will be saved? These two key questions can only be answered at the asset level, thus granular usage data is required. A reduction plan is formed by compiling each asset-level business case for reductions into a large portfolio, and then optimizing the order of implementation based on funding available, age of equipment and so on. Without granular data, money and time is wasted in reduction planning as one is really flying blind.
7 Consistent Data
What is It?
Consistent sustainability data changes from reporting period to reporting period in a transparent and logical way. Inconsistent data has surprises. The source of trouble is lack of rigor in the data set. It grows and shrinks in erroneous ways.
What’s the Challenge?
It is quite difficult to ensure a consistent data set when dealing with hundreds of data sources, dozens of sites and constantly changing asset portfolios. Without an external source of truth – such as the accounting ledger – there is almost no way to ensure complete data. But consistent data also requires the removal of duplicates, and this must be done through repeated checks as the data is prepared.
What’s the Consequence?
In consistent data is quite embarrassing. Suppose your team worked hard and achieved a 5% year over year reduction in emissions. But your data set changed too, and this added 12% to your emissions levels. The error swamps your win.
Without consistent data sets it is quite difficult to reliably track progress, build projections or even explain the annual change in emissions.
How to Get It
The best and easiest method to achieve consistent data is Integrated Reporting, in which each sustainability activity record is tied to an accounting record. Facility lists are also useful, particularly when aligning sustainability reporting with frequent changes in the real estate portfolio.
EXAMPLE
DATA SET INCONSISTENCY
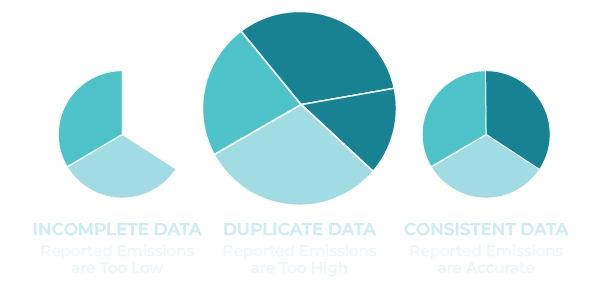
A second source of inconsistent data is duplicates. Duplicate files abound in accounting and ERP systems, arising from multiple instances of SAP, or cost allocation rules. If these are not systematically scrubbed out, emissions can be overreported. We’ve seen duplicates account for 12 – 18% of all Source Files.
Consistent data sets come from strong data management.
8 AI-Ready Data
What is It?
AI-ready data is accurate, verified and enriched. Without high-quality data, enterprise AI (e.g. Chat GPT or LLMs) hallucinates.
What’s the Challenge?
The pace of change in AI is breathtaking. But many sustainability teams are still working off spreadsheets. The contrast is stark. But when AI and sustainability are aligned through Awesome Data, sustainability itself moves to center stage. So, the challenge is to deliver the high-quality data AI needs.
What’s the Consequence?
Leading adopters of AI are surging ahead with more revenue growth, lower costs and relatively higher valuations. Sustainability data from ad hoc systems holds back the enterprise wins. Sustainability data that is AI-ready transforms sustainability into a key corporate player.
How to Get It
The easiest and cheapest granular data is on energy, business and utility invoices. Use a system that reads all the data details. IoT sensors are a second way to capture and track granular data. Invoice and IoT data can be integrated and mapped at each site to the floor and equipment layout, providing a complete picture of usage and costs.
EXAMPLE
ADDING BUSINESS DATA TO SUSTAINABILITY DATA
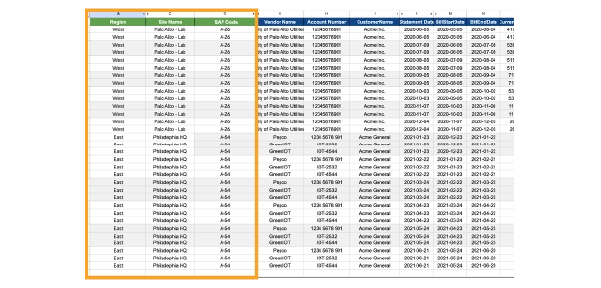
Enterprise AI strategies use Chat GPT-type models (aka LLMs), which are incredibly data hungry. And enterprise AI is at its most powerful when it can scan across business functions in new ways. So adding business data to sustainability data aligns with your AI strategy.
Conclusion
While it is fun to think of Awesome Sustainability Data as frosting on the sustainability cake – a delicious extra – but things have changed, and now each of the eight attributes of Awesome Sustainability Data are a must-have. Without accurate, audited data, sustainability and finance teams run the risk of errors disclosures to regulators, investors and customers. The rigor of Awesome Sustainability Data comes from the system that produces it.
Talk to GLYNT.AI. Data is our only product, and we’re very serious about it. We know the data challenges and how to deliver sustainability data that is awesome – and will delight!

More Like This
The Sustainability Data Buyer’s Guide: Unlock Value with Automation
Read the Guide
Integrated Reporting
Read the Guide
The Reliability Index for Sustainability Data
Read the Guide
The Tech Stack for Sustainability Data
Read the Guide
Contact GLYNT.AI
New to GLYNT.AI
© 2025 GLYNT.AI, Inc. | #betterdatafortheplanet | Terms of Use | Privacy Policy | Compliance Framework
